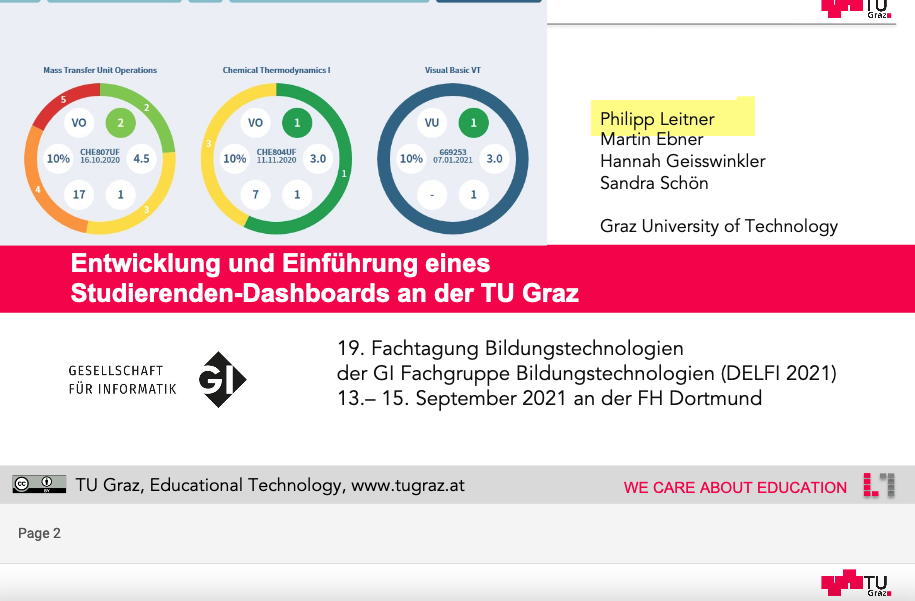
[mooc] Woche 3 im Learning Analytics MOOC zu “Lernförderliche Integration von Learning Analytics” #learningAnalytics #Hochschule #imoox

Und wir sind bereits in Woche 3 des MOOC “Learning Analytics für die Hochschullehre“. Diese Woche geht es um “Beispiel für Learning-Analytics-Dashboards im Bereich von Learning-Management-Systemens” und wir stellen ein konkretes Beispiel vor:

Diese Lektion stellt Learning Analytics Dashboards im Bereich von Learning Management Anwendungen vor. Ein solches Dashboard ist der Learners Corner, der im Projekt “Learning Analytics – Studierende im Fokus” entwickelt wurde, um Lernende beim selbstregulierten Lernen zu unterstützen. Er bietet fünf Widgets, darunter einen Planer und ein Learning Diary Widget. Das Dashboard wird sowohl von Lernenden als auch von Lehrenden genutzt, um das selbstständige Planen und Setzen von Zielen zu fördern. Der Learners Corner wird am Ende des Projekts unter einer freien Lizenz, Open Source, veröffentlicht.

YouTube

Mit dem Laden des Videos akzeptieren Sie die Datenschutzerklärung von YouTube.
Mehr erfahren

Video laden

Die Anmeldung zum MOOC ist natürlich jederzeit möglich: [Anmeldeseite für den kostenlosen Online-Kurs]

[publication] Visualization of Learning for Students: A Dashboard for Study Progress – Development, Design Details, Implementation, and User Feedback #LearningAnalytics #tugraz

We described our dashboard-activities for our students at Graz University of Technology in this chapter about “Visualization of Learning for Students: A Dashboard for Study Progress – Development, Design Details, Implementation, and User Feedback“:

Abstract:
At Graz University of Technology (TU Graz, Austria), the learning management system based on Moodle (https://moodle.org/ – last accessed February 10, 2021) is called TeachCenter. Together with a campus management system – called TUGRAZonline – it is the main infrastructure for digital teaching and general study issues. As central instances for both teachers and students, various services and support for them are offered. The latest developments include the design and implementation of a study progress dashboard for students. This dashboard is intended to provide students a helpful overview of their activities: It shows their academic performance in ECTS compared to the average of their peers, their own study progress, and the official study recommendation as well as the progress in the various compulsory and optional courses. The first dashboard prototype was introduced to all computer science students in May 2020, and a university-wide rollout started in December 2020. The chapter describes design considerations and design development work, implementation, as well as the user feedback on the implementation. Finally, the authors present recommendations as guidelines for similar projects based on their experience and students’ feedback and give an outlook for future development and research.

[article @ book’s homepage]
[draft @ ResearchGate]

Reference: Leitner P., Ebner M., Geisswinkler H., Schön S. (2021) Visualization of Learning for Students: A Dashboard for Study Progress – Development, Design Details, Implementation, and User Feedback. In: Sahin M., Ifenthaler D. (eds) Visualizations and Dashboards for Learning Analytics. Advances in Analytics for Learning and Teaching. Springer, Cham. https://doi.org/10.1007/978-3-030-81222-5_19

[publication] Entwicklung und Einführung eines Studierenden-Dashboards an der TU Graz. Co-Design mit Studierenden, Visualisierungsdetails und Rückmeldungen #Analytics #tugraz

Im Rahmen der heurigen DELFI Konferenz haben wir unsere Arbeiten am Studierenden-Dashboard der TU Graz vorgestellt mit dem Titel “Entwicklung und Einführung eines Studierenden-Dashboards an der TU Graz. Co-Design mit Studierenden, Visualisierungsdetails und Rückmeldungen

In den zentralen Informationssystemen der Technischen Universität Graz (TU Graz), dem auf Moodle basierenden TeachCenter und dem Campusmanagementsystem TUGRAZonline, werden verschiedene Services und Unterstützungen für Lehrende und Studierende angeboten. Zu den neuesten Entwicklungen gehört ein Studienfortschritts-Dashboard für Studierende. Dieses Dashboard soll einen hilfreichen Überblick über die Aktivitäten der Studierenden geben, z. B. über ihre akademischen Leistungen in ECTS im Vergleich zum Durchschnitt ihrer Kommilitonen, über den eigenen Studienfortschritt und die offizielle Studienempfehlung sowie über den Fortschritt in den verschiedenen Pflicht- und Wahlfächern. Der erste Prototyp wurde im Mai 2020 bei den Studierenden der Fakultät für Informatik und Biomedizinische Technik eingeführt, seit Dezember 2020 steht das Dashboard allen – rund 8.700 Bachelor-Studierenden der TU Graz – zur Verfügung. Der Beitrag skizziert die Prozesse und Ergebnisse von der ersten Erwähnung in einem Ideenworkshop für Studierende, über die Entwicklung und stufenweisen Implementierung, sowie die Rückmeldungen der Studierenden.

[full article @ conference homepage]
[full article @ ResearchGate]

Referenz: Leitner, P., Ebner, M., Geisswinkler, H. & Schön, S., (2021). Entwicklung und Einführung eines Studierenden-Dashboards an der TU Graz. Co-Design mit Studierenden, Visualisierungsdetails und Rückmeldungen.. In: Kienle, A., Harrer, A., Haake, J. M. & Lingnau, A. (Hrsg.), DELFI 2021. Bonn: Gesellschaft für Informatik e.V.. (S. 175-180)

[publication] Learning Analytics Cockpit for MOOC Platforms #imoox #LearningAnalytics

Our article about an important extension for iMooX titled “Learning Analytics Cockpit for MOOC Platforms” got publishes now. Enjoy reading 🙂
Abstract:

Within the sector of education, Learning Analytics (LA) has become an interdisciplinary field aiming to support learners and teachers in their learning process. Most standard tools available for Learning Analytics in Massive Open Online Courses (MOOCs) do not cater to the individual’s conception of where Learning Analytics should provide them with insights and important key figures. We propose a prototype of a highly configurable and customizable Learning Analytics Cockpit for MOOC-platforms. The ultimate goal of the cockpit is to support administrators, researchers, and especially teachers in evaluating the engagement of course participants within a MOOC. Furthermore, comparing learner’s individual activity to course wide average scores should enhance the self-assessment of students, motivate their participation, and boost completion rates. Therefore, several metrics were defined which represent and aggregate learner’s activity. From this predefined list, stakeholders can customize the cockpit by choosing from multiple visualization widgets. Although, the current prototype focuses only on a minimal group of stakeholders, namely administrators and researchers. Therefore, it is designed in a modular, highly configurable and customizable way to ensure future extensibility. It can be strongly carried out that customization is integral to deepen the understanding of Learning Analytic tools and represented metrics, to enhance the student’s learning progress.

[Article @ Book’s Homepage]

[Draft @ ResearchGate]

Reference: Maier, K., Leitner, P., & Ebner, M. (2019). “Learning Analytics Cockpit for MOOC Platforms”. In Emerging Trends in Learning Analytics. Leiden, Niederlande: Brill | Sense. doi: https://doi.org/10.1163/9789004399273_014

[workhop, publication] Learning dashboard for supporting students: from first-year engineering to MOOC students #stela #learninganalytics

Our workshop at this year SEFI-conference in Copenhagen about “Learning dashboard for supporting students: from first-year engineering to MOOC students” has been published in the conference proceeding.

By applying learning analytics on indicators that are predictive for a successful transition and online course completion, students can be provided with feedback on in order to improve their self-regulation, hereby providing support during the first-year and in online courses.

[Full conference proceeding]

[Workshop description @ ResearchGate]

Reference: De Laet, T., Broos, T., van Staalduinen, J.P, Ebner, M. (2018) Learning dashboard for supporting students: from first-year engineering to MOOC students. Proceeding of 46th SEFI Conference 17-21 September 2018. pp. 1454-1456. Copenhagen, Denmark

[publication] Development of a Dashboard for Learning Analytics in Higher Education #STELA #LearningAnalytics

Our first publication at this year HCII 2017 conference was about “Development of a Dashboard for Learning Analytics in Higher Education”.
Abstract:

In this paper, we discuss the design, development, and implementation of a Learning Analytics (LA) dashboard in the area of Higher Education (HE). The dashboard meets the demands of the different stakeholders, maximizes the mainstreaming potential and transferability to other contexts, and is developed in the path of Open Source. The research concentrates on developing an appropriate concept to fulfil its objectives and finding a suitable technology stack. Therefore, we determine the capabilities and functionalities of the dashboard for the different stakeholders. This is of significant importance as it identifies which data can be collected, which feedback can be given, and which functionalities are provided. A key approach in the development of the dashboard is the modularity. This leads us to a design with three modules: the data collection, the search and information processing, and the data presentation. Based on these modules, we present the steps of finding a fitting Open Source technology stack for our concept and discuss pros and cons trough out the process.

[Publication @ Springer]

[Draft @ ResearchGate]

Reference: Leitner P., Ebner M. (2017) Development of a Dashboard for Learning Analytics in Higher Education. In: Zaphiris P., Ioannou A. (eds) Learning and Collabo- ration Technologies. Technology in Education. LCT 2017. Lecture Notes in Computer Science, vol 10296. pp. 293-301 Springer, Cham